The Size drop zone drives the size of the visualization's segments or cells according to the given measure. The size drop zone is shown when working with grids, column charts, bar charts, segment charts, scatter charts, advanced charts, gauges, and maps.
Charts
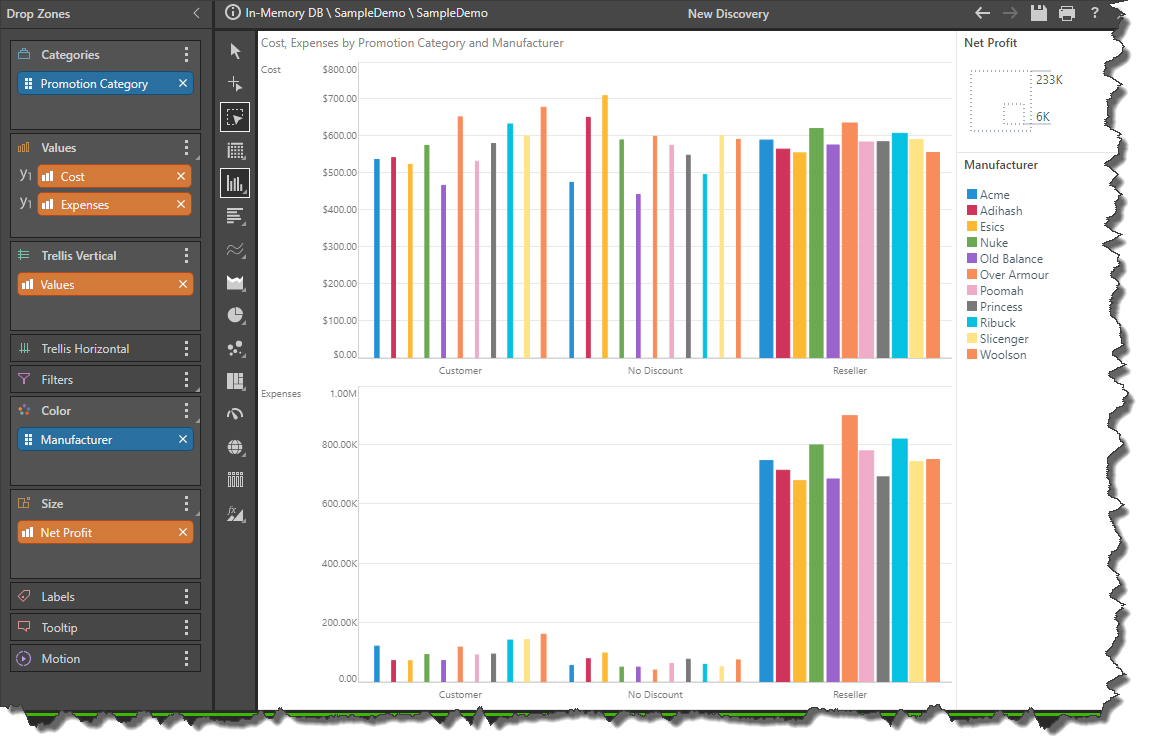
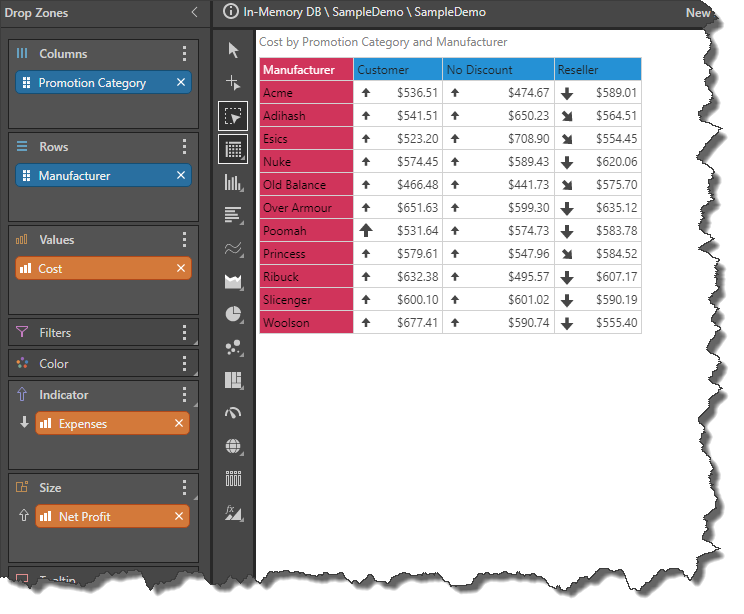
To use the Size drop zone, add a single measure. In the example below, the Net Profit measure was added to the Size drop zone for a trellised column chart. The result is that the column size in both charts is driven by the net profit for the hierarchy in the Categories zone (which, in this case, is Promotion Category).
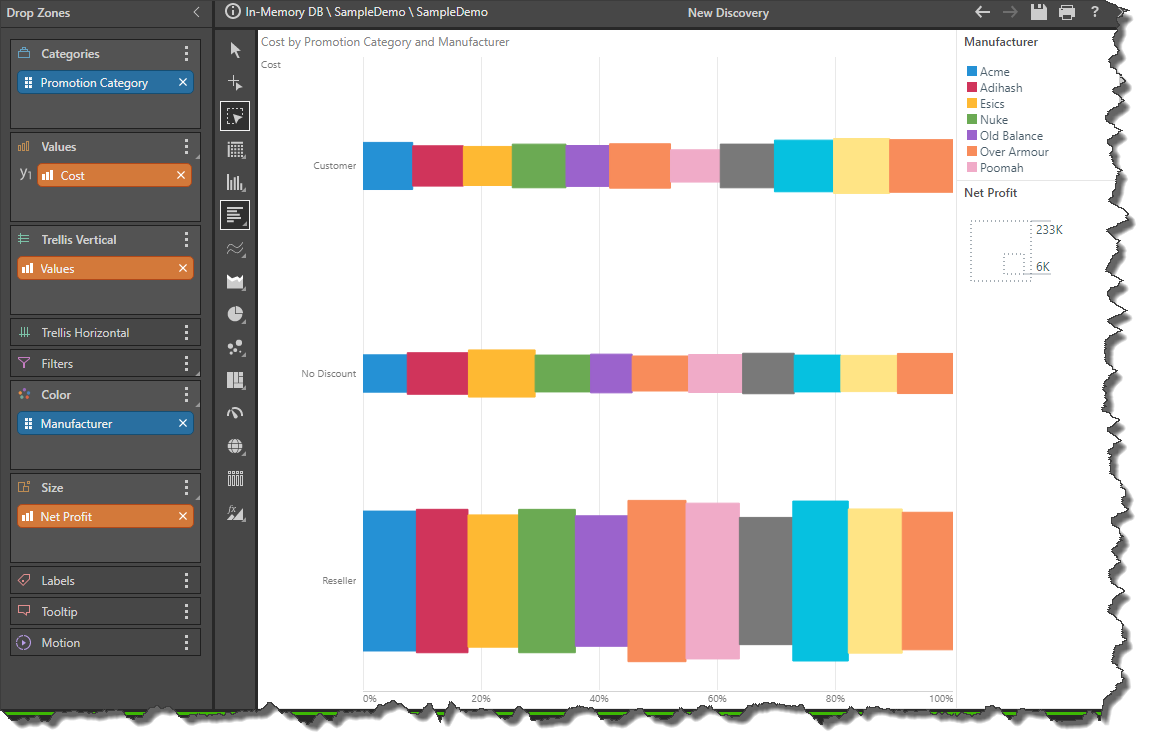
In the image below, the chart was changed from a trellised column chart (above) to an un-trellised Stacked 100% Bar Chart; here the size is driven by net profits for both Promotion Category (in the Categories zone) and Manufacturer (in the Color zone).
Grids
When working with grids, the size logic can be applied to either the font, or indicators. By default, it drives the font size.
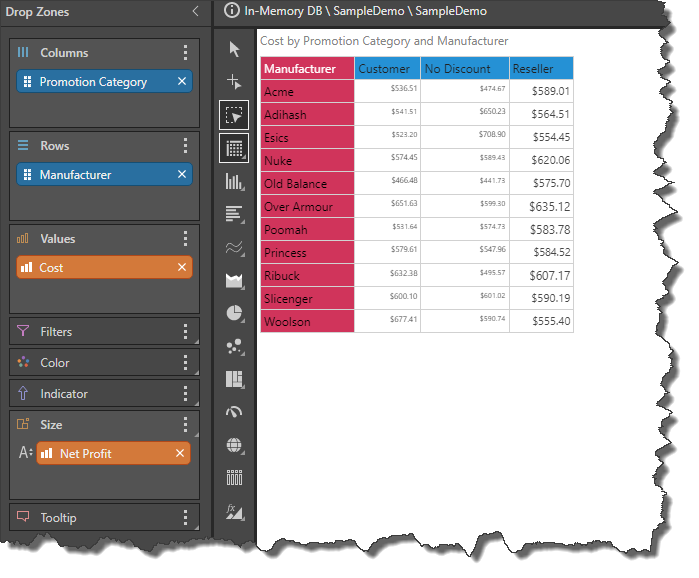
To change the size target and logic, open the submenu and drop the measure under Indicator.
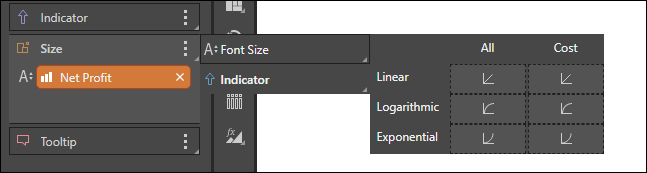
In this example, indicators were chosen as the target for the Size logic.
Size Logic
You may specify one of three types of logic to drive the size: linear regression, logarithmic regression, or exponential regression.
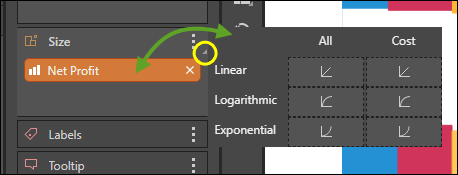
To change the logic, open the Size submenu by dragging the orange chip over the Size zone header, or clicking the expand button (yellow highlight below).